Navigating the world of trading without understanding technical analysis is like setting sail without a map; you might find your way by chance, but you're more likely to get lost. You've likely come across terms such as Ichimoku clouds, Fibonacci retracements, and Bollinger Bands, but grasping how to use these indicators effectively is crucial for making informed decisions.
Moreover, chart patterns like flags and pennants aren't just abstract designs, but signals that can guide your trading journey. Whether you're a seasoned trader or a newcomer, mastering these elements is a stepping stone to elevating your trading strategy.
Let's explore how these tools can enhance your market analysis and decision-making process, setting you on a path to potentially more successful trades.
Key Takeaways
- Understanding various chart types and patterns is crucial for predicting market reversals and trends.
- Technical indicators like RSI, MACD, and Bollinger Bands provide insights into market momentum and entry/exit points.
- Volume analysis plays a key role in confirming trends and making informed trading decisions.
- Effective trading strategies and risk management hinge on interpreting market sentiment and leveraging chart patterns and technical indicators.
Understanding Chart Types
To effectively navigate the complexities of financial markets, it's crucial you understand the various chart types, each offering unique insights into market dynamics. Among these, the head and shoulders chart stands out as a pivotal pattern for identifying potential reversals in market trends. This pattern, not a chart type per se but a formation within them, is essential for your toolkit.
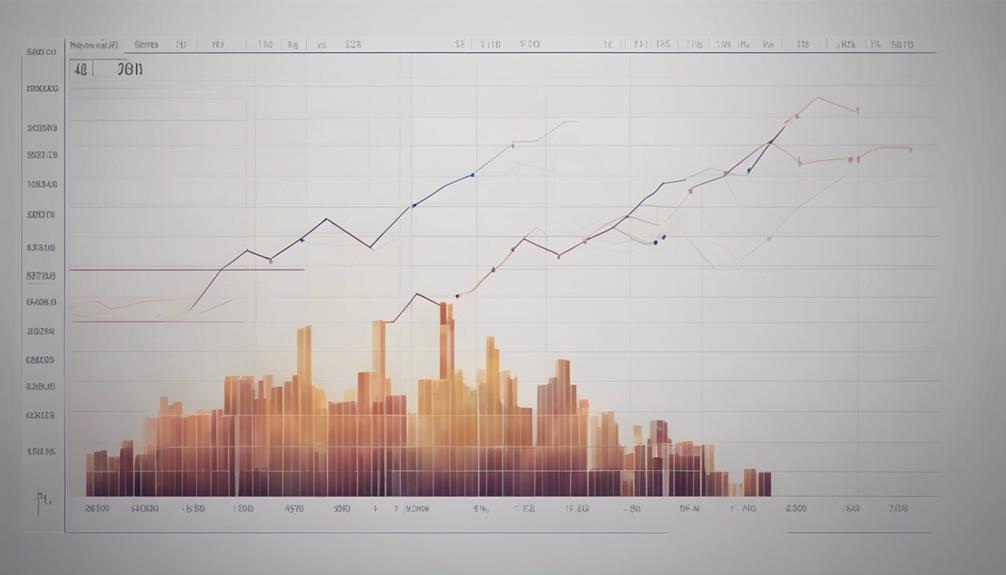
Bar charts, with their detailed depiction of price movements — showing open, high, low, and close prices — offer a foundational understanding. They're instrumental in spotting the formation of the head and shoulders pattern, a harbinger of trend reversal. Line charts, connecting closing prices over time, further simplify the visualization of this pattern, distilling complex market movements into understandable trends.
Your mastery of these chart types, alongside recognizing the critical patterns they reveal, like the head and shoulders, empowers you to anticipate market shifts with greater precision. It's this analytical prowess that sets apart successful traders, enabling them to make informed decisions in the fast-paced financial markets. Embrace these tools, refine your analysis, and the path to mastery in technical analysis will be yours.
Candlestick Patterns Explained
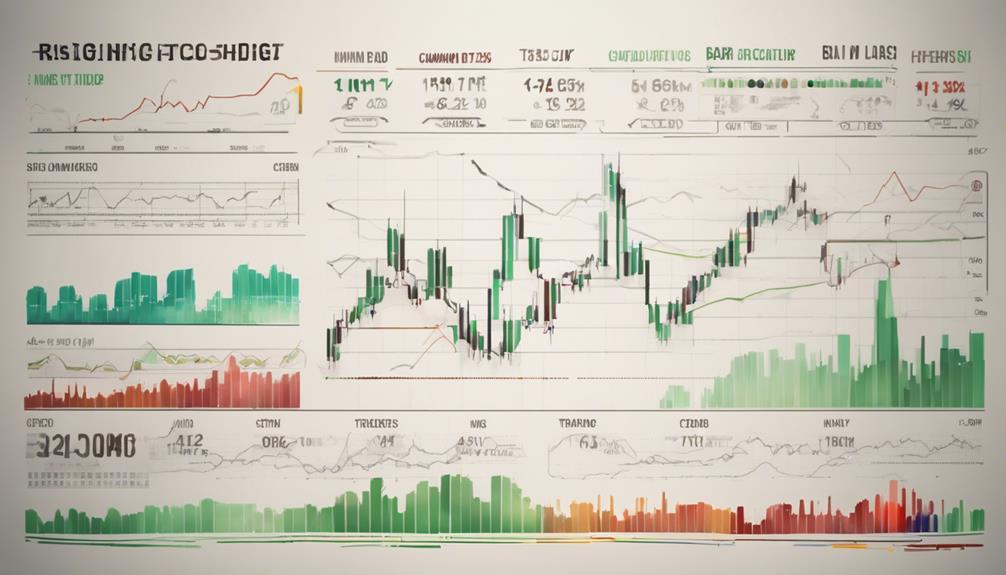
Building on your understanding of chart types, it's crucial to explore candlestick patterns, a technique that originated in Japan and offers deep insights into market psychology and potential price movements. These chart patterns are foundational in analyzing financial markets, providing a visual representation of buyer and seller dynamics over a specific period.
Common candlestick patterns like Doji, Hammer, Shooting Star, and Engulfing patterns are critical in predicting future price movements. A Doji, characterized by its cross-like shape, indicates market indecision. In contrast, the Hammer, with its long lower wick, signals potential bullish reversals, suggesting that buyers are starting to outweigh sellers.
Bearish patterns such as the Shooting Star, which resembles an inverted hammer, forewarn of potential price declines. Similarly, Engulfing patterns, where a larger candle body fully encompasses a smaller one, can signify both bullish and bearish reversals depending on their placement in a trend.
Understanding these patterns not only aids in identifying potential trend reversals or continuations but also offers invaluable insights into market sentiment. Mastering candlestick patterns equips you with the ability to discern potential trading opportunities, a skill paramount for navigating the complexities of financial markets efficiently.
Key Technical Indicators

Diving deeper into technical analysis, you'll find that key technical indicators such as moving averages, RSI, MACD, Bollinger Bands, and the Stochastic Oscillator are essential tools for deciphering market trends and making informed trading decisions. Each indicator provides a unique lens through which to view the chart, enabling you to identify potential buy or sell opportunities based on historical data and current market conditions.
To fully grasp their utility, consider the following aspects:
- RSI (Relative Strength Index) offers insights into overbought or oversold conditions, signaling potential reversals.
- MACD (Moving Average Convergence Divergence) tracks the relationship between two moving averages, highlighting momentum and possible entry or exit points.
- Bollinger Bands help determine whether a security's price is high or low on a relative basis, offering clues about future movements.
- Stochastic Oscillator compares a security's closing price to its price range over a specific period, pinpointing potential trend shifts.
Mastering these indicators demands practice and a keen eye for detail. By incorporating them into your analysis, you enhance your ability to make educated decisions, grounded in a comprehensive understanding of market dynamics.
Moving Averages Uncovered
After exploring key technical indicators, let's focus on moving averages, a fundamental tool for identifying market trends and making strategic trading decisions. Moving averages are essential trend-following indicators that simplify price data, enabling you to discern the market's direction with greater clarity. They come in two main types: simple moving averages (SMA) and exponential moving averages (EMA). SMAs distribute equal weight across all prices within a specified period, offering a straightforward view of price movement. In contrast, EMAs prioritize recent prices, providing a more responsive insight into current market dynamics.
You'll find moving averages invaluable for confirming trends, pinpointing support and resistance levels, and generating actionable buy or sell signals. A critical strategy involves observing the crossover of short-term moving averages above or below their long-term counterparts, a phenomenon that could signal an impending trend shift. This tool effectively filters market noise, focusing your attention on the underlying trend and facilitating more informed trading decisions. Remember, mastery in using moving averages lies in recognizing their strengths in trend analysis and their role in your broader trading strategy.
The Role of Volume

Volume, when analyzed alongside price movements, can significantly enhance your understanding of market trends and trading decisions. In technical analysis, volume refers to the number of shares or contracts traded in a security or market during a specific period. This metric is pivotal for traders seeking to master market dynamics, as it provides a depth of insight not visible through price action alone.
Here's how volume analysis plays a crucial role:
- High Volume and Price Movements: High trading volume often accompanies significant price movements, signaling strong investor interest. This can indicate a potential trend continuation, guiding you to align your trades accordingly.
- Volume Confirmation: Volume serves as a confirmation tool for price trends and breakouts. A price movement backed by high volume is more likely to sustain, giving you confidence in your trading decisions.
- Accumulation and Distribution: Analyzing volume can help you identify accumulation (buying) or distribution (selling) patterns. Recognizing these patterns early can alert you to potential reversals or continuations in the trend.
- Enhanced Market Analysis: Understanding volume patterns in conjunction with price movements equips you with a more comprehensive view of the market, enabling more precise trading strategies.
Mastering volume analysis is essential for those who aim to navigate the complexities of market trends and make informed trading decisions.
Classic Chart Patterns
Building on your understanding of volume's impact on market trends, let's explore how classic chart patterns can further enhance your trading strategy by providing clear visual cues for potential price movements. Classic chart patterns, including the head and shoulders, double tops, and symmetrical triangles, are foundational tools in the technical analyst's toolkit. They offer a systematic way to interpret market sentiment and predict future price actions.
The head and shoulders chart pattern, in particular, is renowned for signaling a reversal in trend. It's characterized by three peaks, with the middle peak (the head) being the highest and the two others (shoulders) at a lower level. This pattern indicates that the current trend is weakening, and a reversal is imminent, providing a strategic entry or exit point for traders.
Understanding these patterns helps you make informed decisions based on historical price action. Each pattern comes with distinct characteristics and implications for price movement, offering valuable insights into potential market movements. Mastery of recognizing and interpreting these patterns ensures you're well-equipped to identify trend reversals, continuations, and breakout opportunities, thereby refining your trading strategy for better outcomes.
Trading Strategies and Tips
To elevate your trading proficiency, it's crucial to integrate specific strategies and tips that can sharpen your market analysis and decision-making. By focusing on these strategies, you enhance your ability to navigate the complexities of the market effectively.
Here are critical pointers to guide your trading journey:
- Utilize the three black crows pattern as a bearish reversal signal in your trading strategies. This pattern signifies a potential shift from a bullish to a bearish market, helping you make timely decisions.
- Understand the significance of trading the support level of a stock for potential price reversals. Identifying these levels allows you to pinpoint where the market sentiment may change, offering opportunities for entry or exit.
- Identify and avoid falling into a bear trap, a deceptive market situation trapping traders into making unfavorable decisions. Recognizing these scenarios prevents unnecessary losses and enhances your market foresight.
- Utilize Fibonacci retracement levels to identify potential entry or exit points in trading. These levels are instrumental in understanding market trends and making informed decisions based on the likelihood of price reversals.
Mastering these strategies and tips equips you with the analytical tools necessary for adept trading, particularly in spotting bearish reversals and optimizing your risk management.
Frequently Asked Questions
What Is the Difference Between Chart Patterns and Technical Indicators?
You're diving into the world of trading, and you're curious about the difference between chart patterns and technical indicators. Here's the scoop:
Chart patterns are visual, focusing on shapes and trends on the price chart, like head and shoulders. They're about spotting potential moves.
Technical indicators, on the other hand, are math-based, offering insights into market trends and momentum through calculations.
Both tools are crucial, but they approach market analysis from different angles.
What Are the Charting Patterns in Technical Analysis?
In technical analysis, you'll encounter charting patterns like head and shoulders, double tops, symmetrical triangles, cup and handle, and pennants. These patterns aren't just shapes; they're the market's way of whispering its next move.
What Are the Four 4 Basic Principles of Technical Analysis?
The four basic principles of technical analysis you need to know are:
- Market prices incorporate all available info, meaning everything's already baked into the charts.
- Prices follow trends, either up, down, or sideways.
- History tends to repeat itself, so past price behavior can hint at future moves.
- The price discounts everything, emphasizing the importance of price movements over other factors.
Mastering these principles is crucial for informed trading decisions.
What Are the Basic Charts in Technical Analysis?
You're diving into the ocean of technical analysis, where charts are your compass.
The basic types you'll encounter are line charts, which simplify price movements to closing prices over time; bar charts, revealing price ranges and the open and close within specific periods; and candlestick charts, offering a detailed view with open, high, low, and close prices.
Mastering these charts is crucial for navigating the waves of market trends and making informed decisions.
Conclusion
In wrapping up, remember that 'a stitch in time saves nine.'
By mastering chart types, deciphering candlestick patterns, leveraging key indicators like the Ichimoku and Fibonacci, and understanding volume's role, you're stitching your success early.
Embrace moving averages and classic patterns to navigate markets confidently.
With these strategies and tips, you're not just trading; you're crafting a tailored path to financial triumph.
Keep studying, stay disciplined, and your trading skills will undoubtedly flourish.